PropRussell
Three lower closes in the Russell 2000, then long until the first higher close. A forward test, not a proven edge.
PropRussell buys the Russell 2000 CFD at the US cash close when the index has closed lower three days in a row while above its 200 day average, and sells at the first higher close. The rule comes from my study of pullback rules on 15 markets: it passed the search period there and narrowly missed the holdout (t 1.8). On real Pepperstone prices +22.6 basis points per trade remain at t 1.5, and random entries in the same uptrend reach that in 14 percent of the draws. That is not proof. I publish the EA anyway, free, because a forward test on a demo account is the only check still open, and because I would rather show what narrowly fails than quietly sell it.
Standalone EA: PropRussell opens positions on its own and usually holds them overnight, often over a weekend. If your account does not allow weekend holding, it does not fit.
Free
Download right here (.ex5 for MetaTrader 5), no Market, no activations.
What it looks like on the chart
The rule on the chart
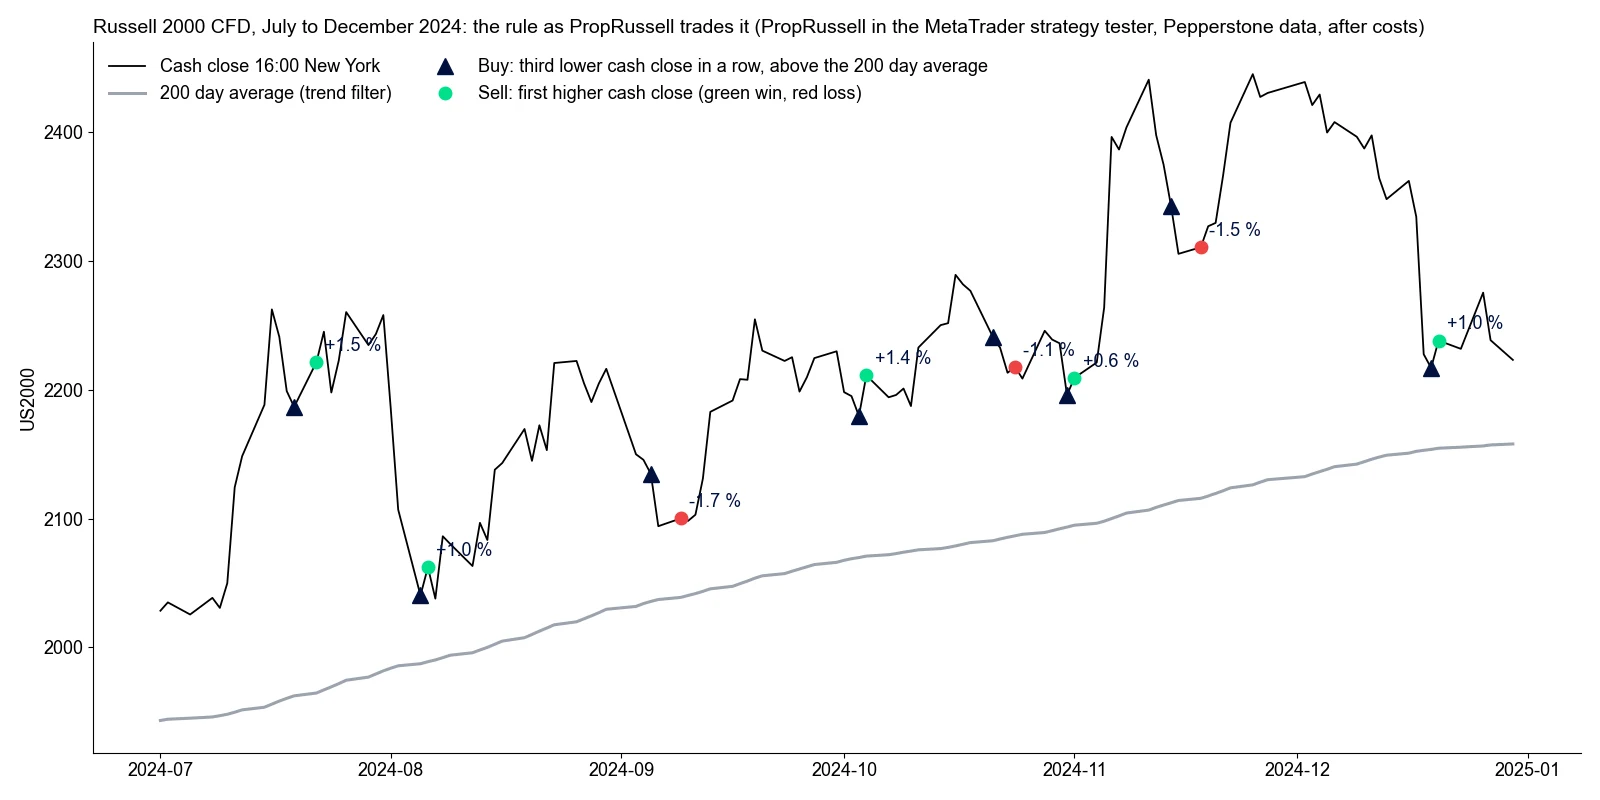
Russell 2000 CFD from July to December 2024 on Pepperstone data, the way PropRussell traded it in the strategy tester, after costs. I chose this half year because it has the most trades: eight, three of them losses, so a bit worse than the 67 percent winners in the whole test. My first, pre-chosen window (first half of 2025) had a single trade.
What it does differently
The same engine as PropDip
Cash close at 16:00 New York from the M30 candles, fill in the first minutes after it, protective stop, risk in percent of equity, panel and journal: all taken from PropDip unchanged. Only the signal differs, and the parts that execute orders are byte for byte the same.
Checked against the tester
The rule in Python on the Pepperstone cash closes 2019 to 2026 gives 58 trades. The EA in the strategy tester takes the same 58 signal days and the same exits, and the result per trade differs by 0.01 basis points on average.
Why the stop is so far away
With PropDip’s 3 ATR stop, 3 of 58 trades were stopped out and the return fell from +22.6 to +8.7 basis points. The default is therefore a catastrophe stop at 10 ATR, which never triggered in the test. Mean reversion does not tolerate tight stops; the position size carries the risk.
What a forward test can do
At about 7 trades a year and 114 basis points of spread per trade, a forward test detects a true edge of 23 basis points with 29 percent probability after 4 years and 45 percent after 8. Whoever runs it collects data, not certainty.
Test results
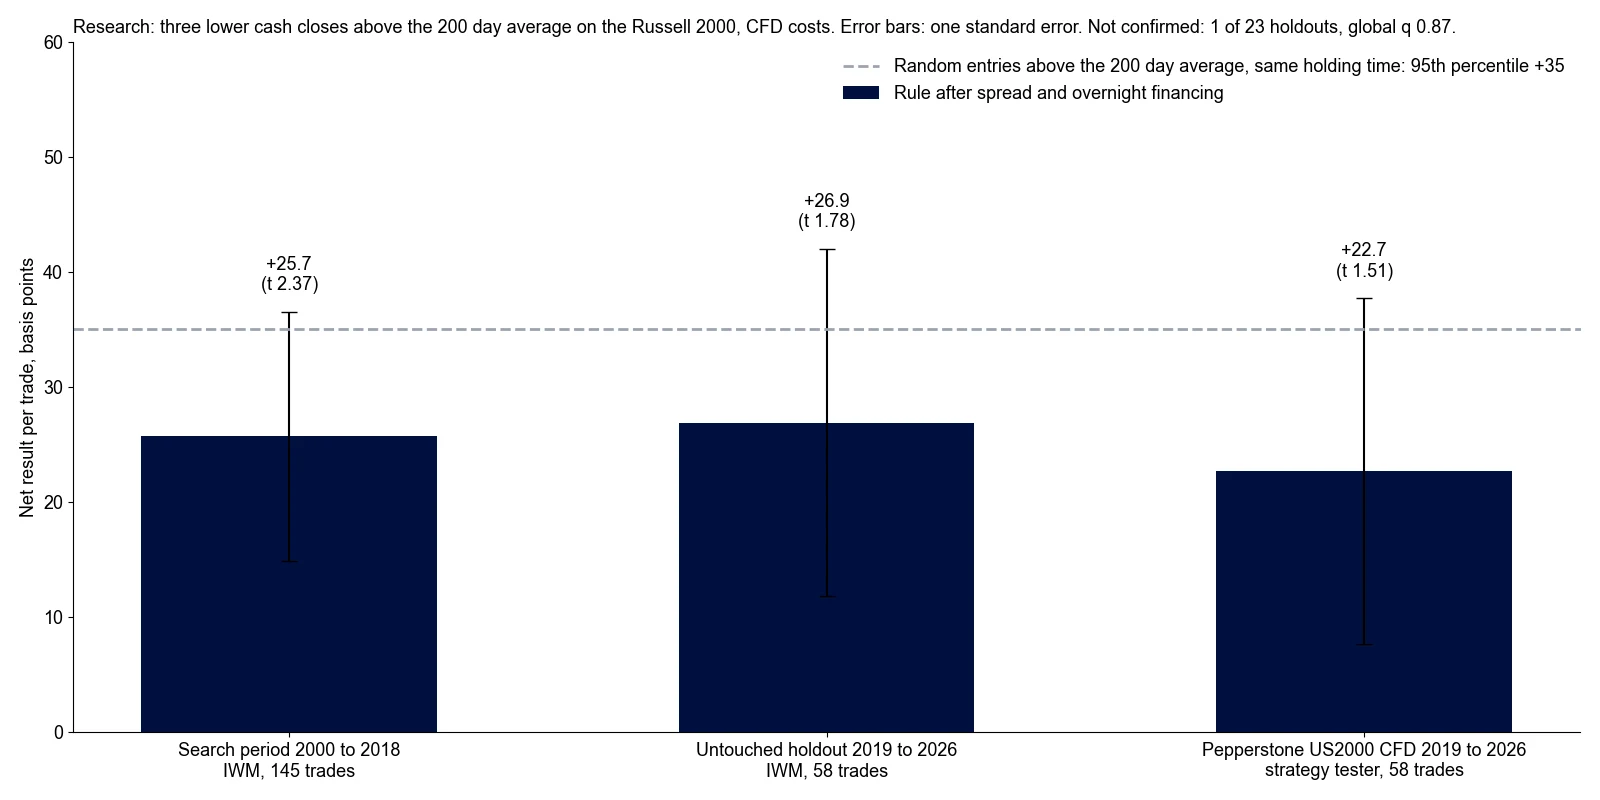
The research the rule comes from: daily closes of IWM (the Russell 2000 ETF) with CFD costs, search period 2000 to 2018, one untouched holdout 2019 to 2026, then the real Pepperstone cash closes of the US2000 CFD.
Per trade: search period, holdout, real CFD
- Search period 2000 to 2018 (IWM)
- 145 trades, +25.7 basis points per trade (t 2.4)
- Holdout 2019 to 2026 (IWM)
- 58 trades, +26.9 basis points per trade (t 1.8)
- Pepperstone US2000 CFD 2019 to 2026
- 58 trades, +22.7 basis points per trade (t 1.5), 67 % winners
- Random entries above the 200 day average
- same holding time: mean 0, 95th percentile +35; the rule sits at p 0.14
- Global multiple testing correction
- q 0.87, not passed (1 of 23 holdouts in the study)
- As an account, 100 % position value, no leverage
- +13.6 % over 7.8 years (about 1.7 % a year), largest drawdown 8.8 %
All three numbers point the same way, none of them stands on its own. A t of 1.5 on 58 trades means chance explains it just as well.
- A backtest is not a promise. Past results do not guarantee future ones.
- The rule was picked among 23 market-rule cells of a study as the best of the failures. That is selection on the result, which is exactly why only the forward test counts.
- Pepperstone’s US2000 history starts in 2018, and the first 200 days go into the trend filter.
What it does not do
- No proven edge: holdout t 1.8, real CFD t 1.5, random p 0.14. Whoever trades this as a signal trades a hunch.
- Small return even in the best case: about 7 trades a year at 0.2 % of the position value, so around 1.7 % a year without leverage.
- No tight stop: the 10 ATR stop is a catastrophe stop. A trade can lose several percent before the rule exits.
- About two thirds of the trades run over a weekend; Friday entries carry the fattest losses.
What you need
- MetaTrader 5, hedging or netting account
- Russell 2000 cash CFD at your broker (US2000 or similar), not a forward
- Demo account recommended: this is a forward test
- Terminal or VPS running at 16:00 New York
PropRussell · Free
Download right here (.ex5 for MetaTrader 5), no Market, no activations.
You have your own strategy and want it as an EA? I build it for you, tested on real ticks, with full source code.
From the same family
- PropGuardian ↗ · 79 USDCloses your positions before the prop firm closes your account.
- PropMirror ↗ · 59 USDOne trade on the master, the same position on each of your accounts.
- ForcedFlow · 499 USDTrades flows in which someone has to buy or sell at a fixed time.
- PropDip · 99 USDBuys short dips in the US indices, with a rule that was measured before it was built.
- PropStockDip · 49.99 USDBuys short pullbacks in S&P 500 stocks, one chart for the whole list.
- PropSizer ↗ · freeDrag two lines, read the right lot size.
- PropCorrelation ↗ · freeShows whether your open positions are really one single bet.