PropDip
Buys short dips in the US indices, with a rule that was measured before it was built.
PropDip trades an old, public rule on the S&P 500, Nasdaq 100 and Dow CFDs: buy at the US cash close when RSI(2) drops below 10 while the index is above its 200 day average, sell at the first close above the 5 day average. I measured it with spread and overnight financing on 2000 to 2018 and tested it once on 2019 to 2026. It is the second rule of my research that passed the correction for multiple testing. The return is small, and that comes first here.
Standalone EA: PropDip opens positions on its own and usually holds them overnight, often over a weekend. If your account does not allow weekend holding, it does not fit.
99 USD one-time
No subscription. 10 activations. Purchase, licence and invoice run through the MQL5 Market.
What it looks like on the chart
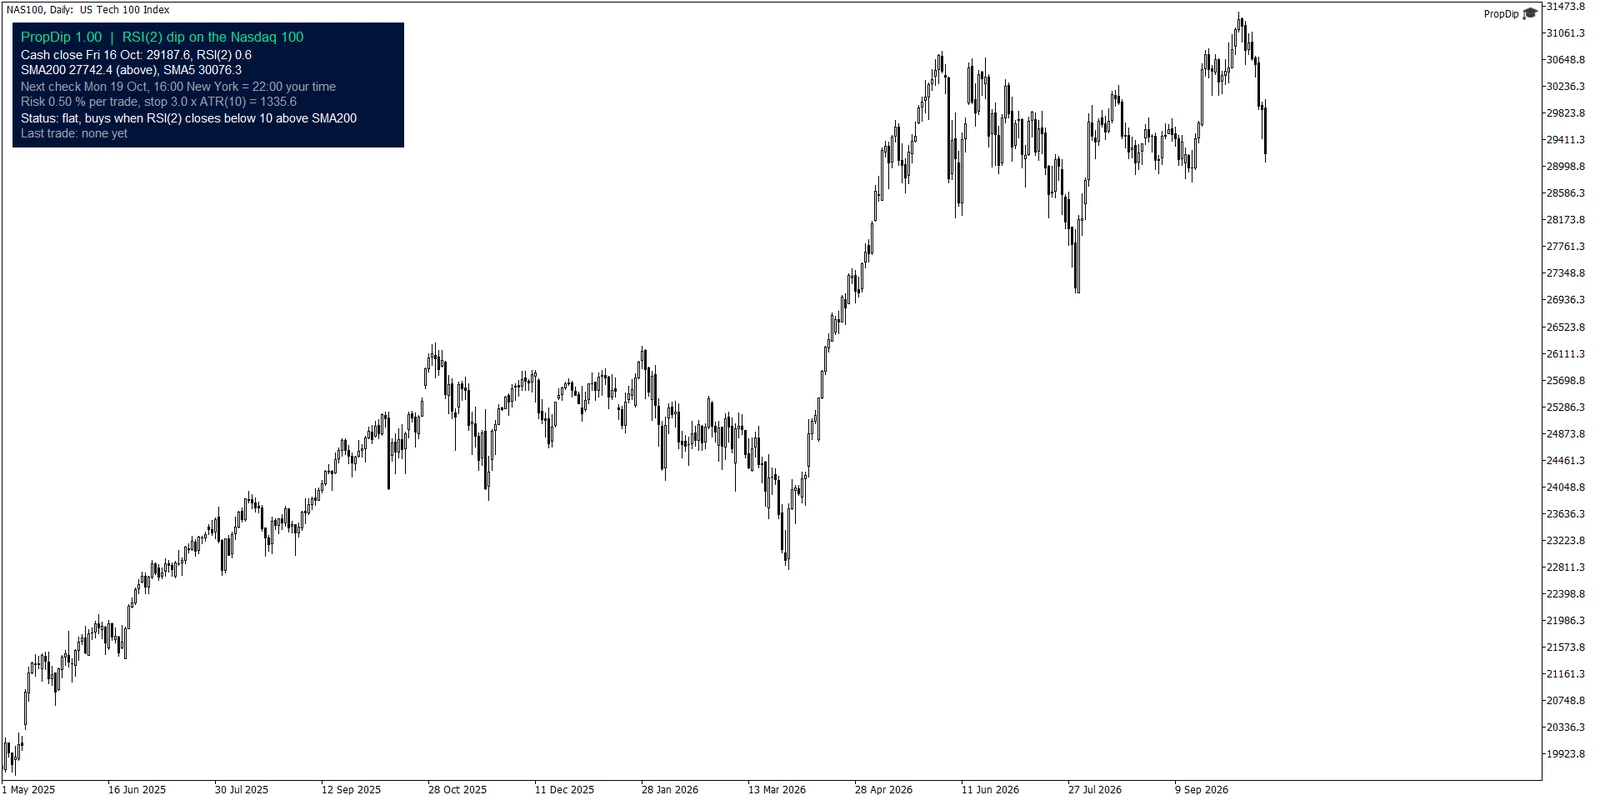
Panel on the Nasdaq 100
The panel shows the last cash close at 16:00 New York with RSI(2), the 200 and 5 day averages, the next check in your local time, the risk with the distance of the protective stop and the status. There is nothing else to set: the rule has no thresholds to move.
The rule on the chart
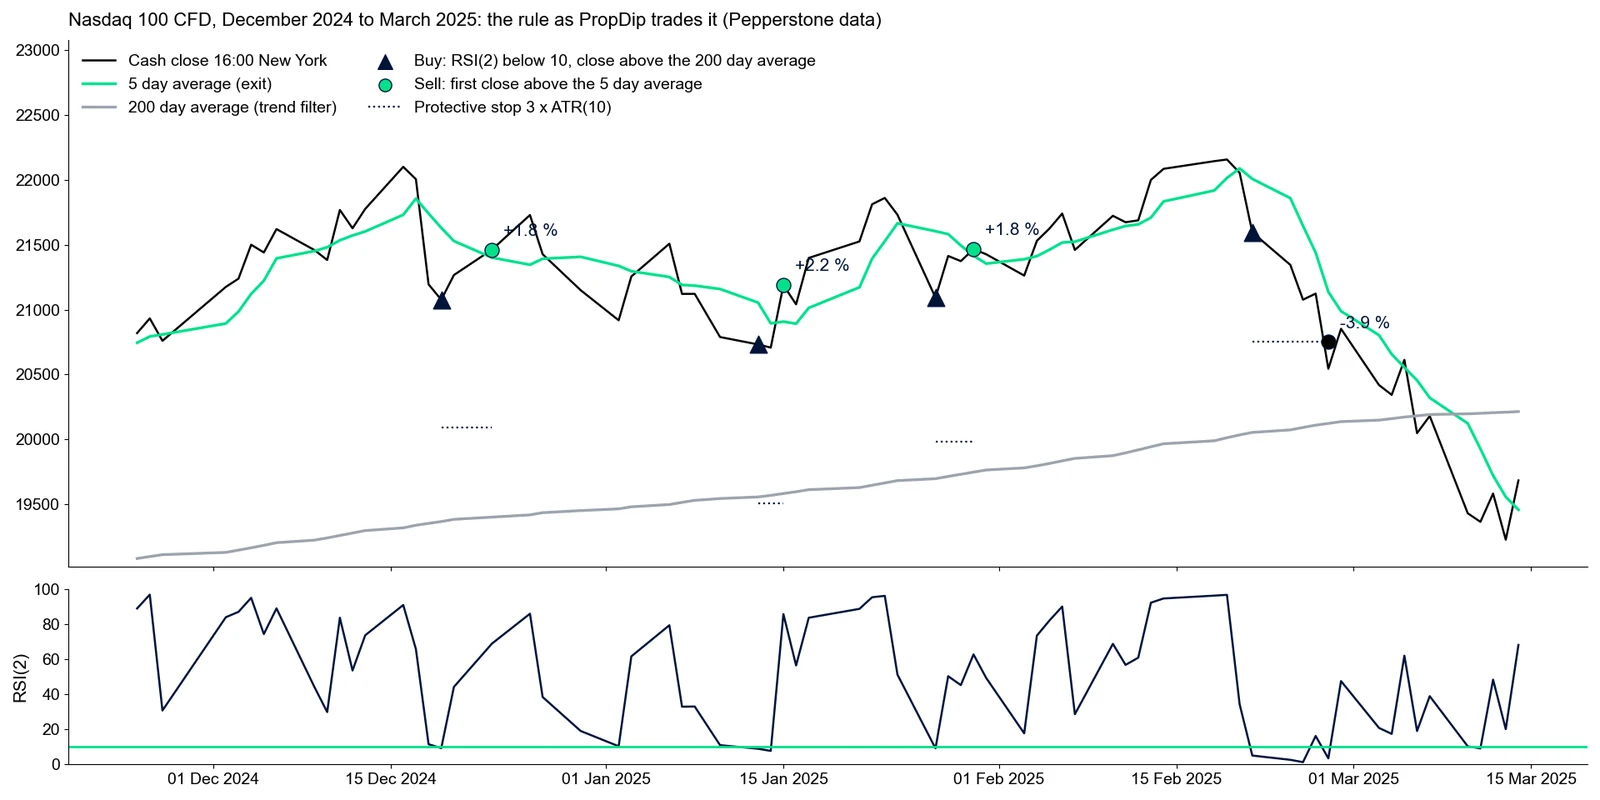
Nasdaq 100 from December 2024 to March 2025 on Pepperstone data, the way PropDip trades it: three buys after a dip that ended in profit at the first close above the 5 day average, and one buy in the February 2025 sell off that ended at the stop. Both belong to the rule.
Journal
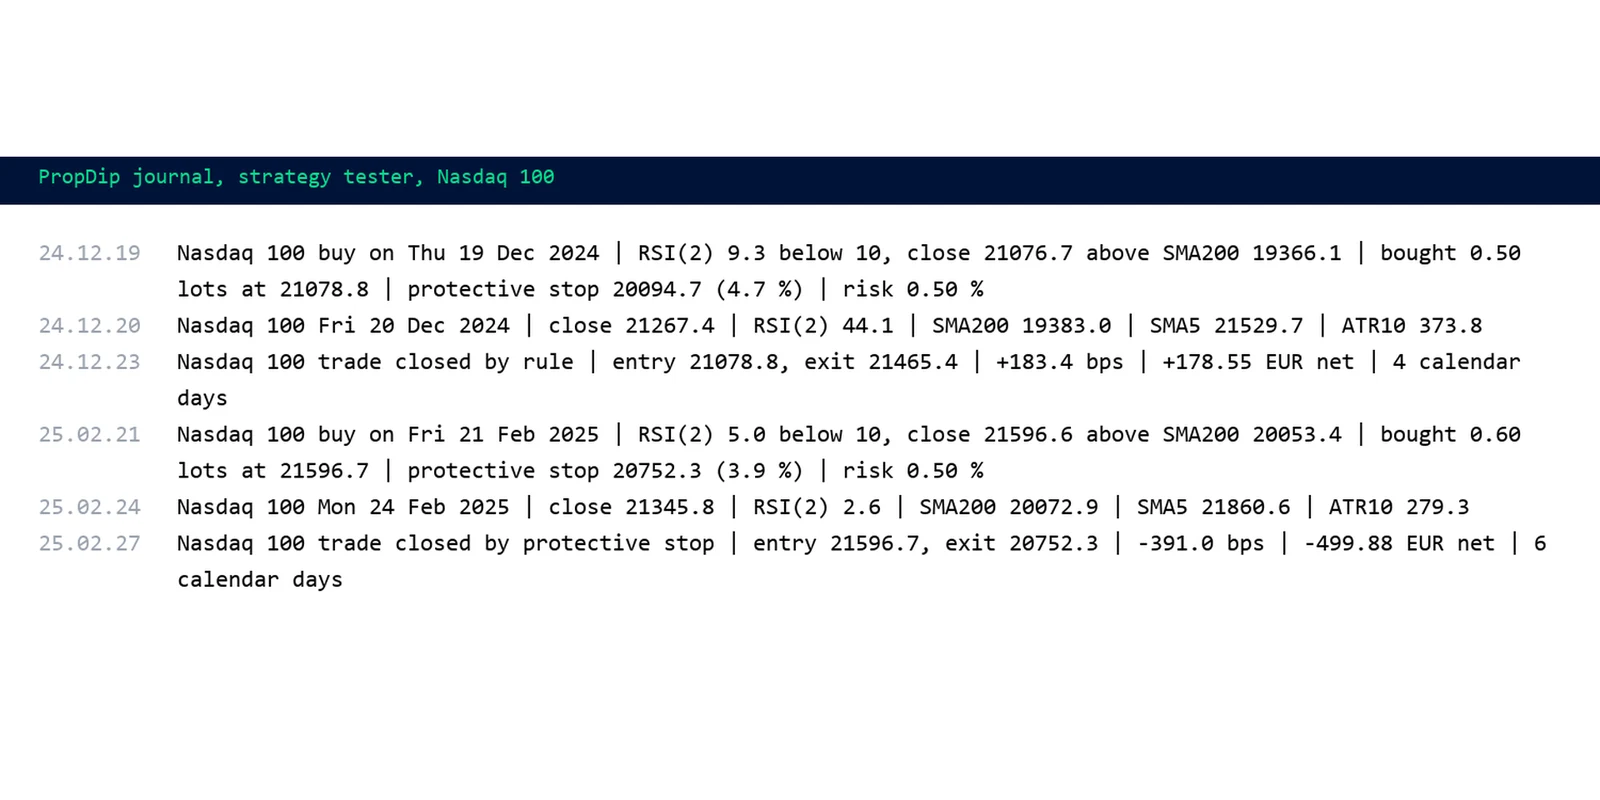
Every buy and every exit is in the journal with its reason: RSI(2), close and 200 day average at entry, result in basis points and in money after commission and swap at exit. Optionally PropDip logs the daily values at every cash close.
One chart per index
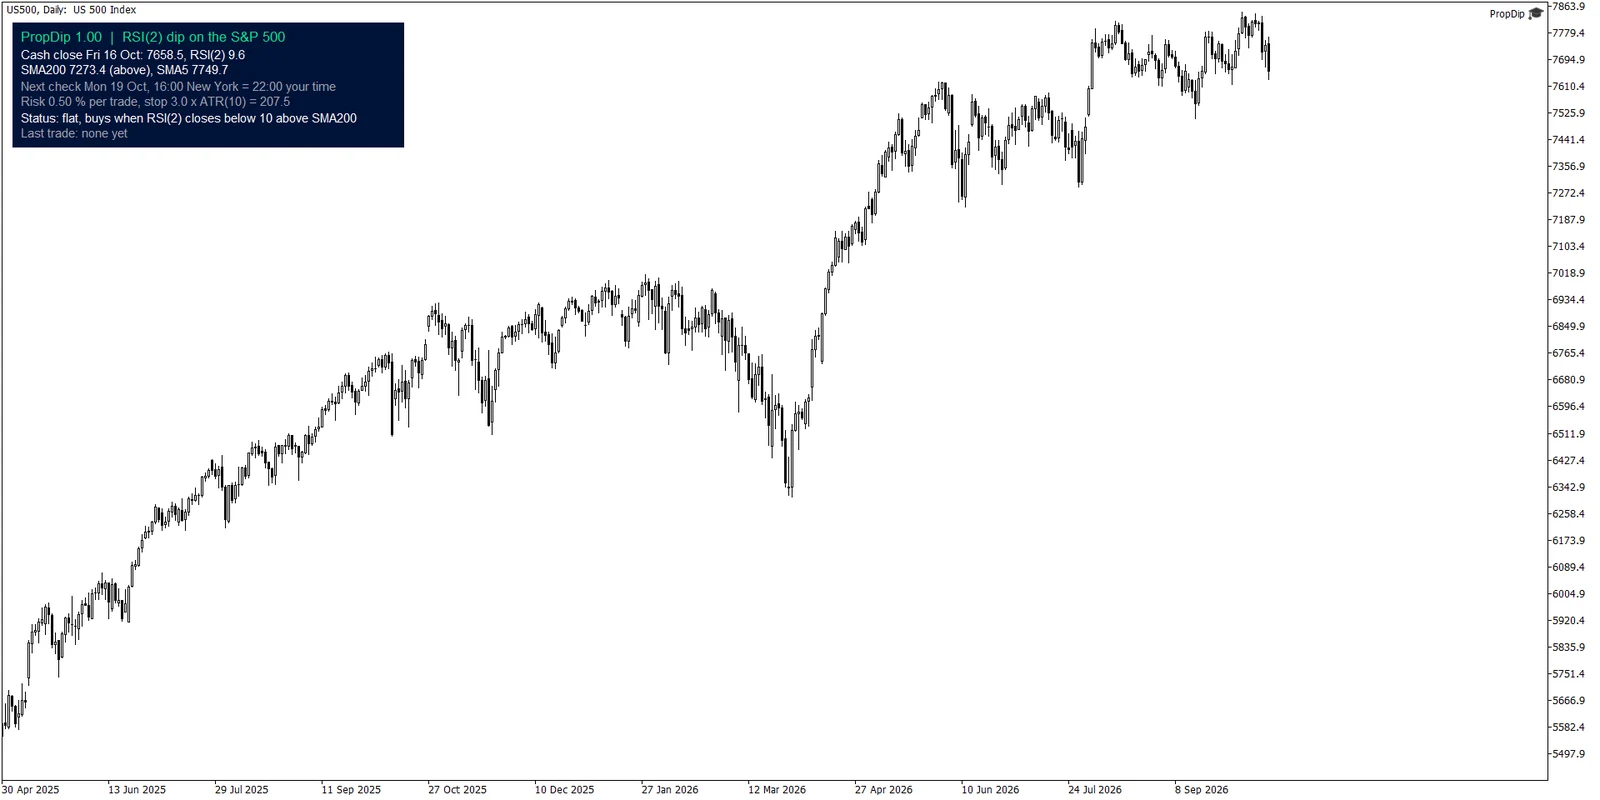
The same panel on the S&P 500. Each index gets its own magic number, so three charts never get in each other’s way. The three indices often signal on the same day, though, and three positions are then one bet.
What it does differently
Built on the cash close
Index CFDs trade almost around the clock, and their daily candle does not end at the US close. PropDip builds its daily series from the prices at 16:00 New York, the close the rule was tested on, and trades between 16:00 and 16:15 New York.
Nothing to optimise
RSI(2) below 10, the 200 and 5 day averages, at most 20 days: the values are fixed in the code. Only risk, stop distance and spread limit can be set.
Checked against the tester
In the strategy tester on Pepperstone data PropDip produces the same daily values and the same entry and exit days as my Python calculation on the same prices, 66 of 66 entries on the Nasdaq 100.
No martingale, no grid
One position per index, a protective stop of 3 × ATR(10) on every trade, margin, volume and spread checked before every order. Nothing is opened twice after a restart.
Test results
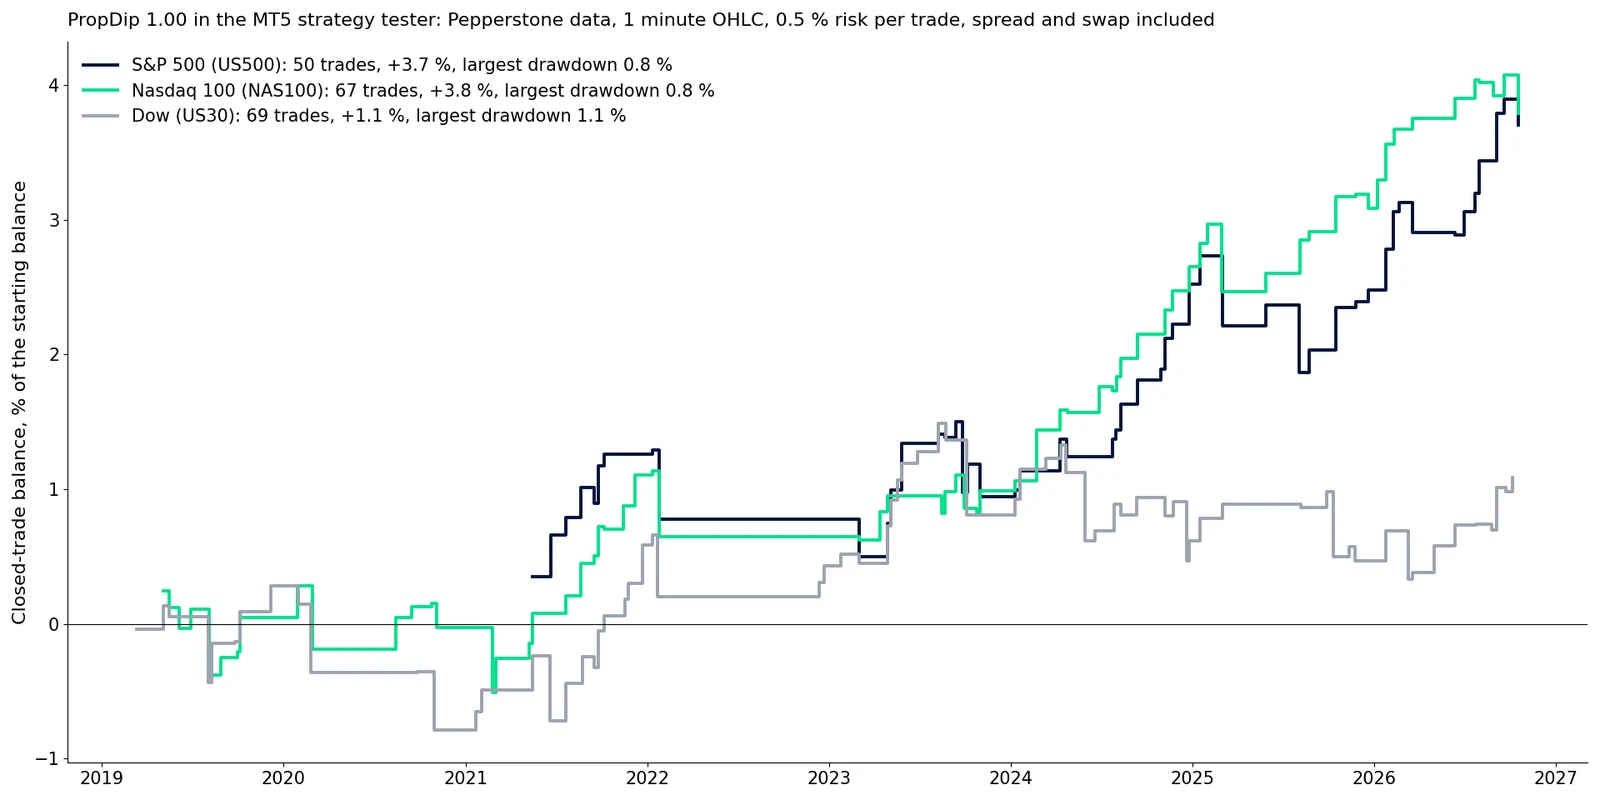
Two views: the MetaTrader strategy tester with the settings you get on purchase (0.5 percent risk per trade at the protective stop, 100,000 EUR starting balance, Pepperstone demo, spread and swap included), and the research on 26 years of daily data the rule comes from.
MT5 strategy tester, all three indices
- Period
- Nasdaq 100 and Dow from 2019, S&P 500 from May 2021, to October 2026, 1 minute OHLC
- Trades
- S&P 500 50 · Nasdaq 100 67 · Dow 69
- Result
- +3.7 % · +3.8 % · +1.1 %
- Per year
- +0.68 % · +0.51 % · +0.14 %
- Largest drawdown
- 0.85 % · 0.79 % · 1.14 % of equity
- Profit factor
- 2.13 · 1.97 · 1.19
This broker’s S&P 500 history has no cash session before 2020, so that test starts later. The Dow is the weakest market in the research as well. At 0.5 percent risk PropDip moves the account only slowly; that is the price of a stop that survives a sell off.
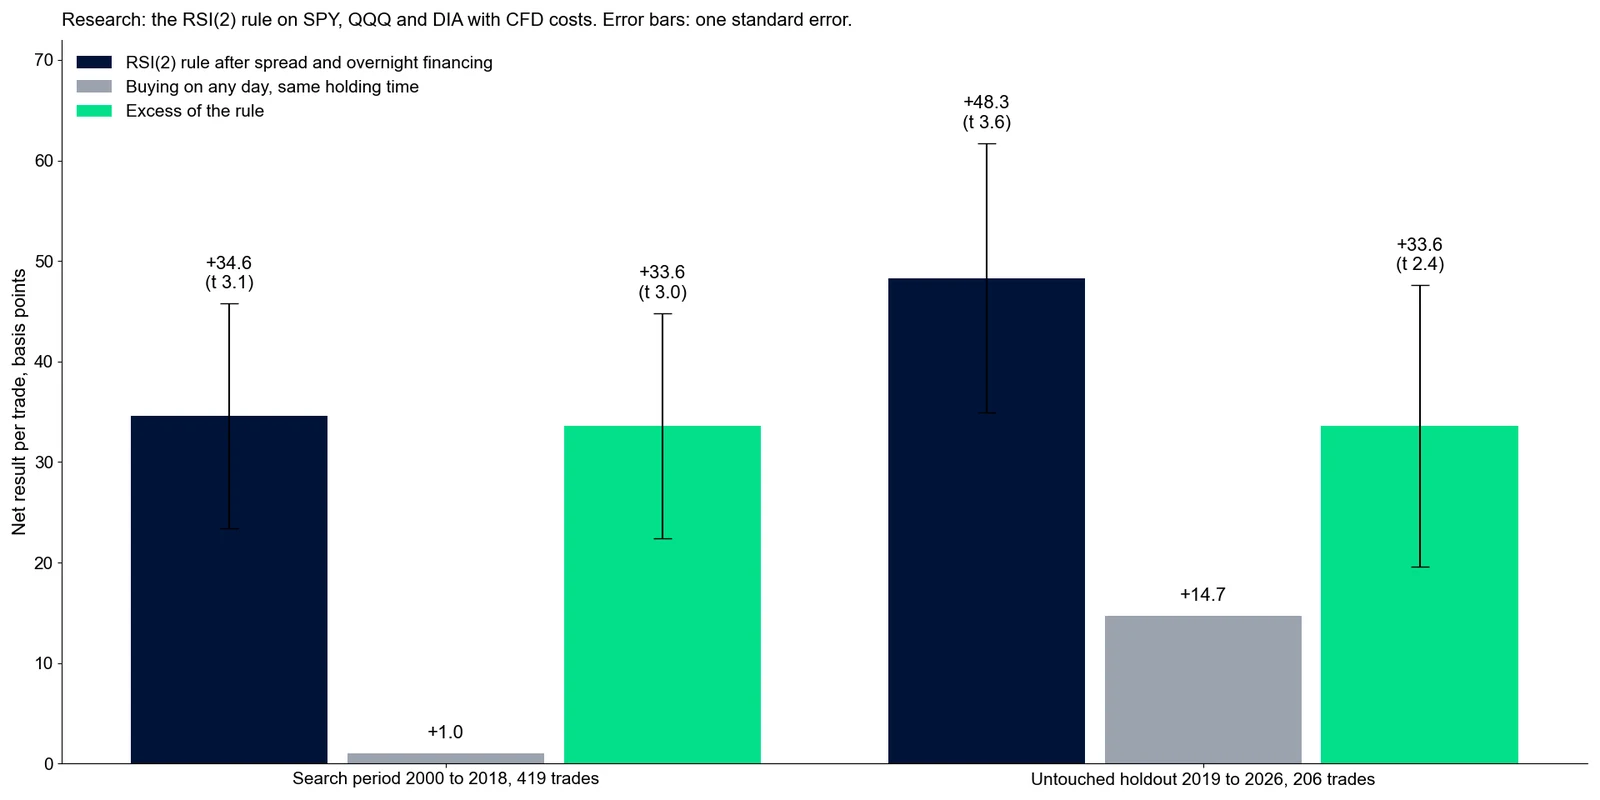
Research: search period and untouched holdout
- Data
- SPY, QQQ, DIA daily, 2000 to October 2026
- Costs
- Spread 2 basis points and the overnight financing of a cash CFD
- 2000 to 2018
- 419 trades, +34.6 basis points per trade (t 3.1)
- Holdout 2019 to 2026
- 206 trades, +48.3 basis points per trade (t 3.6)
- Against random entries
- +33.6 basis points in both periods (t 3.0 and 2.4)
- All three indices, 0.5 % risk each
- about +1.0 % a year until 2018, +1.7 % a year from 2019
The holdout fell into a bull market, where buying on any day already made +14.7 basis points. The more honest number is therefore the excess of +33.6. Closing on Fridays instead of holding over the weekend cut the 2000 to 2018 result on the S&P 500 from +36 to +2 basis points per trade.
- A backtest is not a promise. Past results do not guarantee future ones.
- The rule has been public since 2008 and has held up since. Crowding and decay are possible.
- Mean reversion has rare large losses: 2020 and 2022 were negative years, and the worst trades in the tests ended at the stop.
What it does not do
- Small returns: at 0.5 percent risk about half a percent a year per index.
- About two thirds of the trades run over a weekend. Without weekend holding the edge disappears.
- The three indices often signal on the same day. Three charts are then one bet in triple size.
What you need
- MetaTrader 5, hedging or netting account
- Cash CFD on US500, NAS100 or US30 (no forward CFD)
- An account that allows weekend holding
- Terminal or VPS running at 16:00 New York
PropDip · 99 USD one-time
No subscription. 10 activations. Purchase, licence and invoice run through the MQL5 Market.
You have your own strategy and want it as an EA? I build it for you, tested on real ticks, with full source code.
From the same family
- PropGuardian · 79 USDCloses your positions before the prop firm closes your account.
- PropMirror · 59 USDOne trade on the master, the same position on each of your accounts.
- ForcedFlow · 499 USDTrades flows in which someone has to buy or sell at a fixed time.
- PropSizer · freeDrag two lines, read the right lot size.
- PropCorrelation · freeShows whether your open positions are really one single bet.