Market Analogy Studio
Today’s trading day against thirteen years of real market data. Not a signal generator — a tool that shows how days like this one played out historically.
One corpus, four ways in, one result language.
The same trading days can be interrogated four ways — by similarity, by rules, by archetype, or in training mode. Whichever route you take, you get the same day cards, the same detail view with previous and following day, the same outcome statistics. And every access point links into the others.
Today
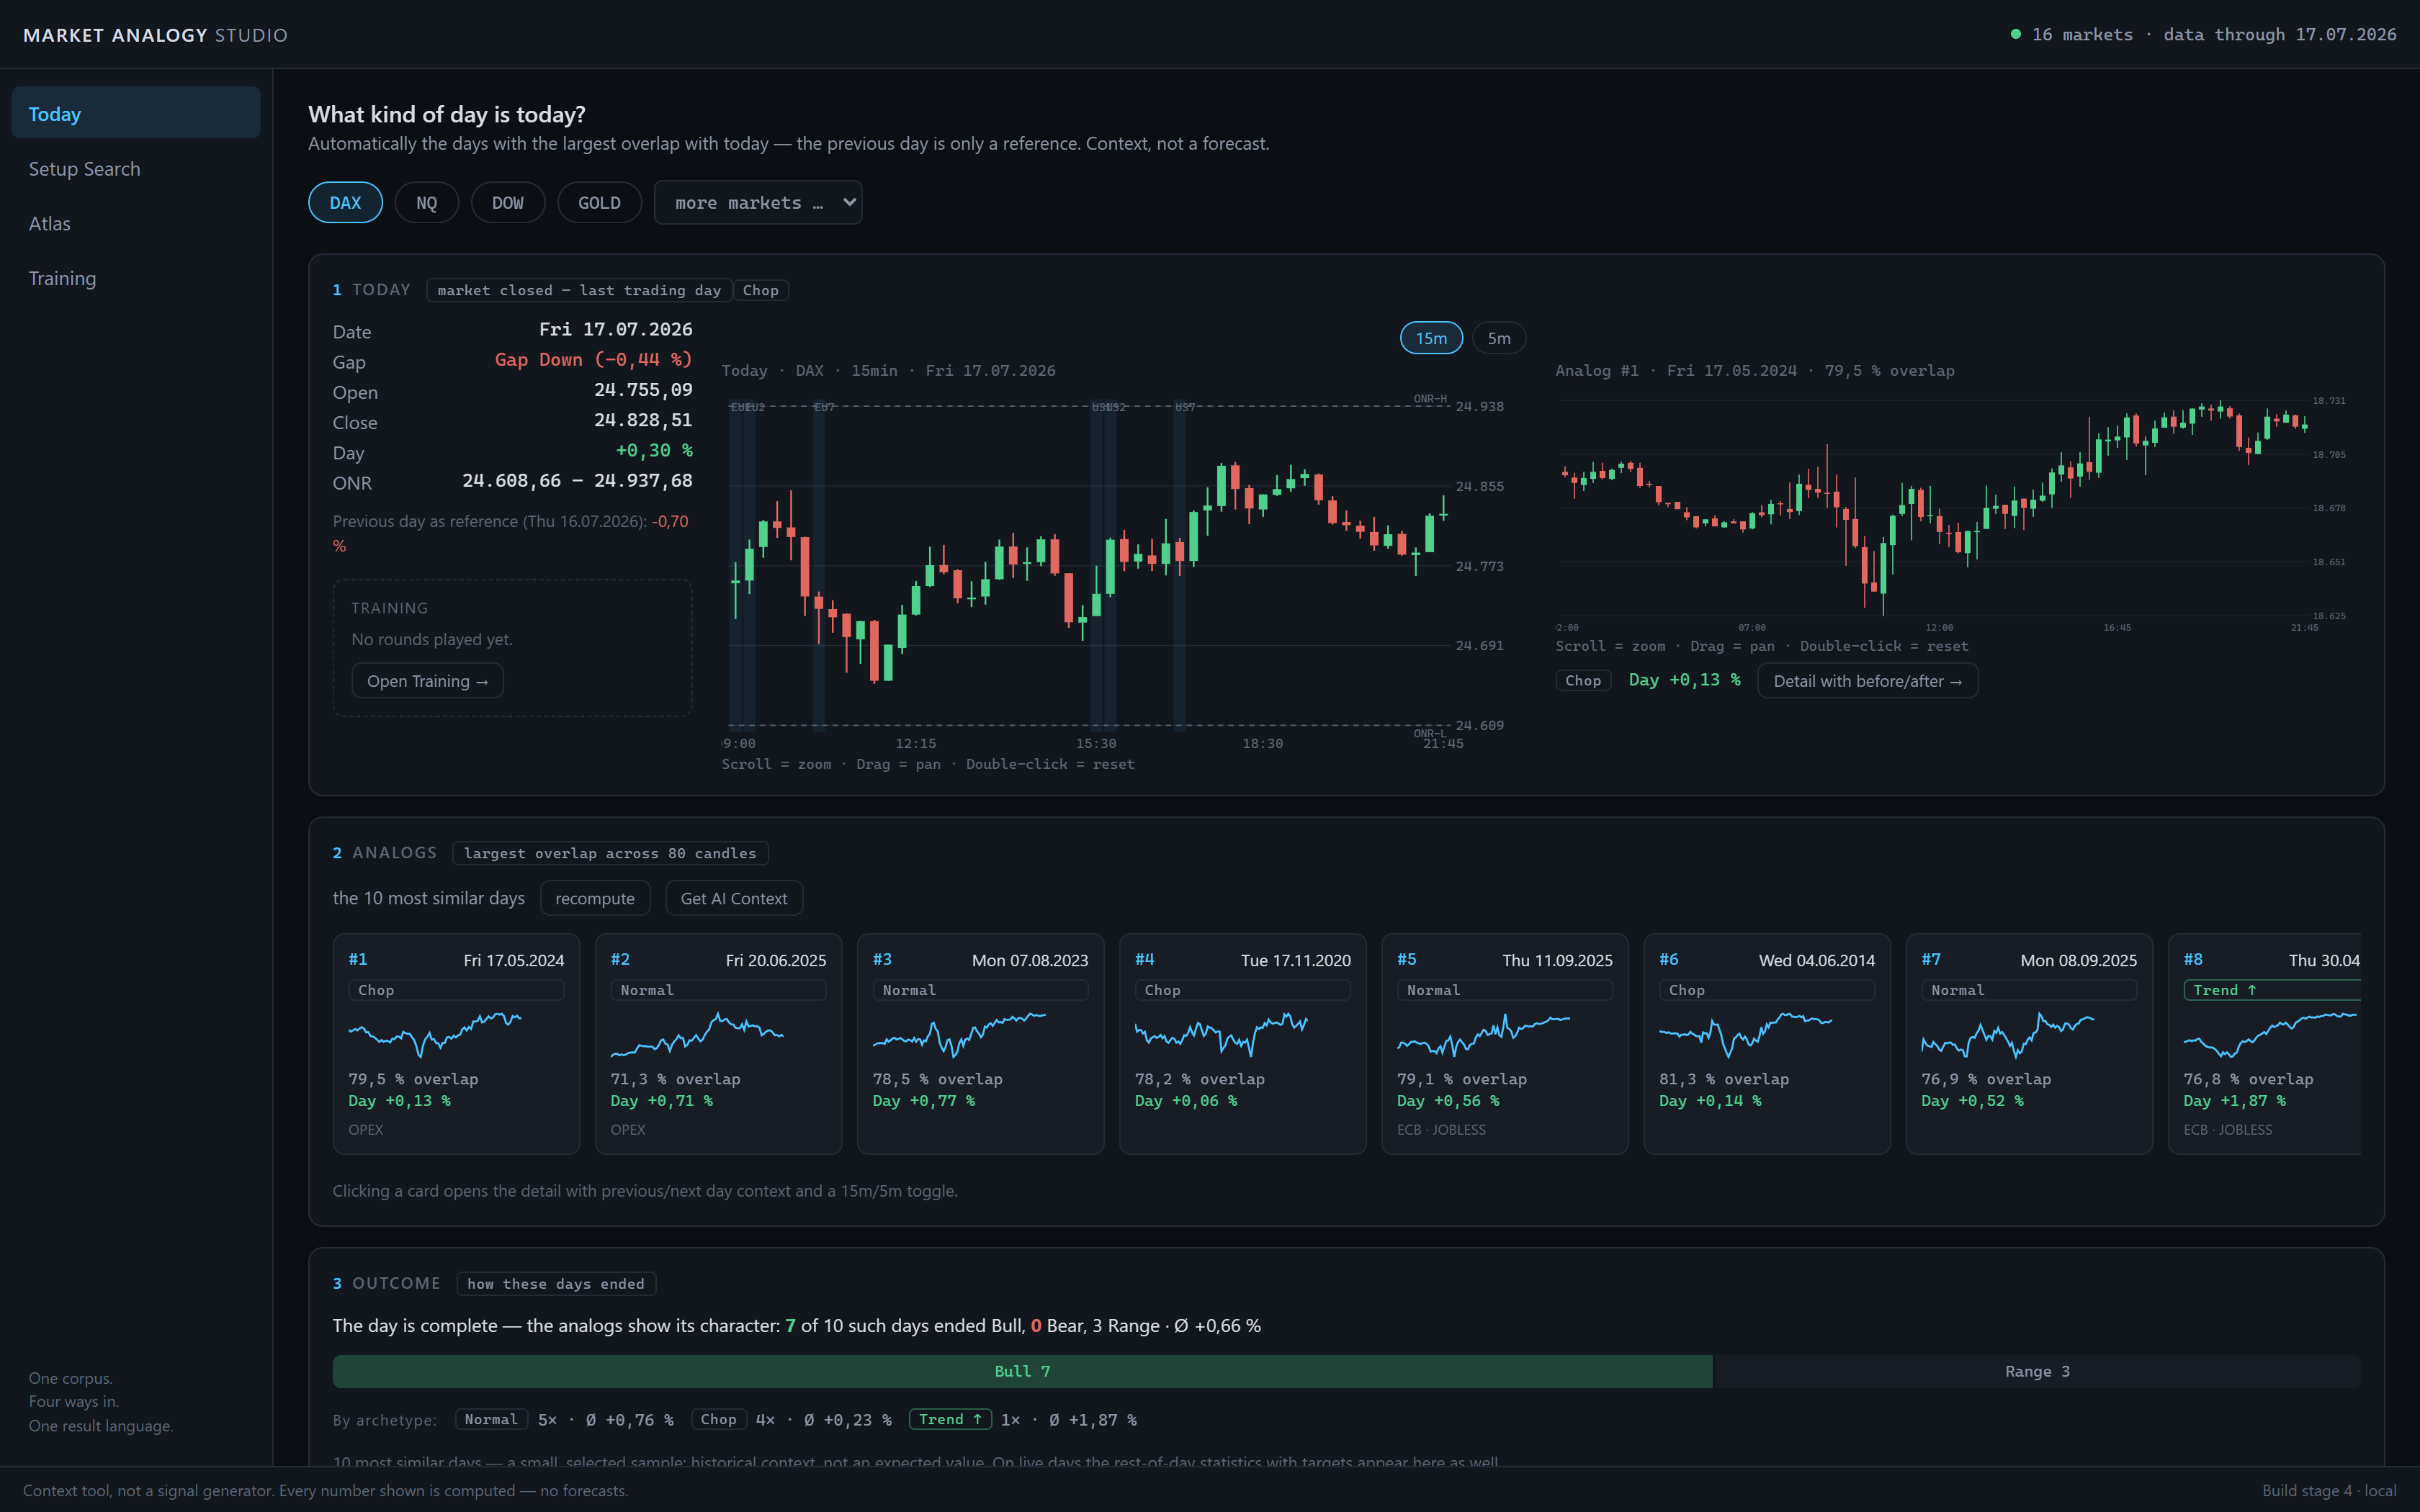
“Which day in history overlaps most with today?”
Today is the reference. The studio compares the candles already printed against every trading day in the corpus and shows the largest overlap next to today’s chart, with the ten closest days below. The previous day enters only as context.
Setup Search
“All days matching condition X and Y?”
The rule-based access: pick an anchor candle (EU 1st 15min, US 2nd, Gold 14:15 …) and tick properties — bullish, close above ONR, strong body, inside bar. Plus gap, weekday, archetype, events and event proximity. The result is a testable cohort with follow-up-day projection.
Atlas
“Show me every whipsaw day.”
The archetype gallery: trend, V-reversal, whipsaw, chop — classified via path efficiency, close location, range-to-ATR, timing of extremes and double break. Sorted by typicality, clearest cases first, with base rates per category.
Training
“How good is my eye, really?”
A random historical day, hidden from the 2nd or 7th candle on — overnight range included. You call long, short or chop. Resolution runs against a mechanical definition of the day’s outcome. The breakdown shows your hit rate per market and per outcome type — measured against the base rate, not against 50 percent.
The studio at work.
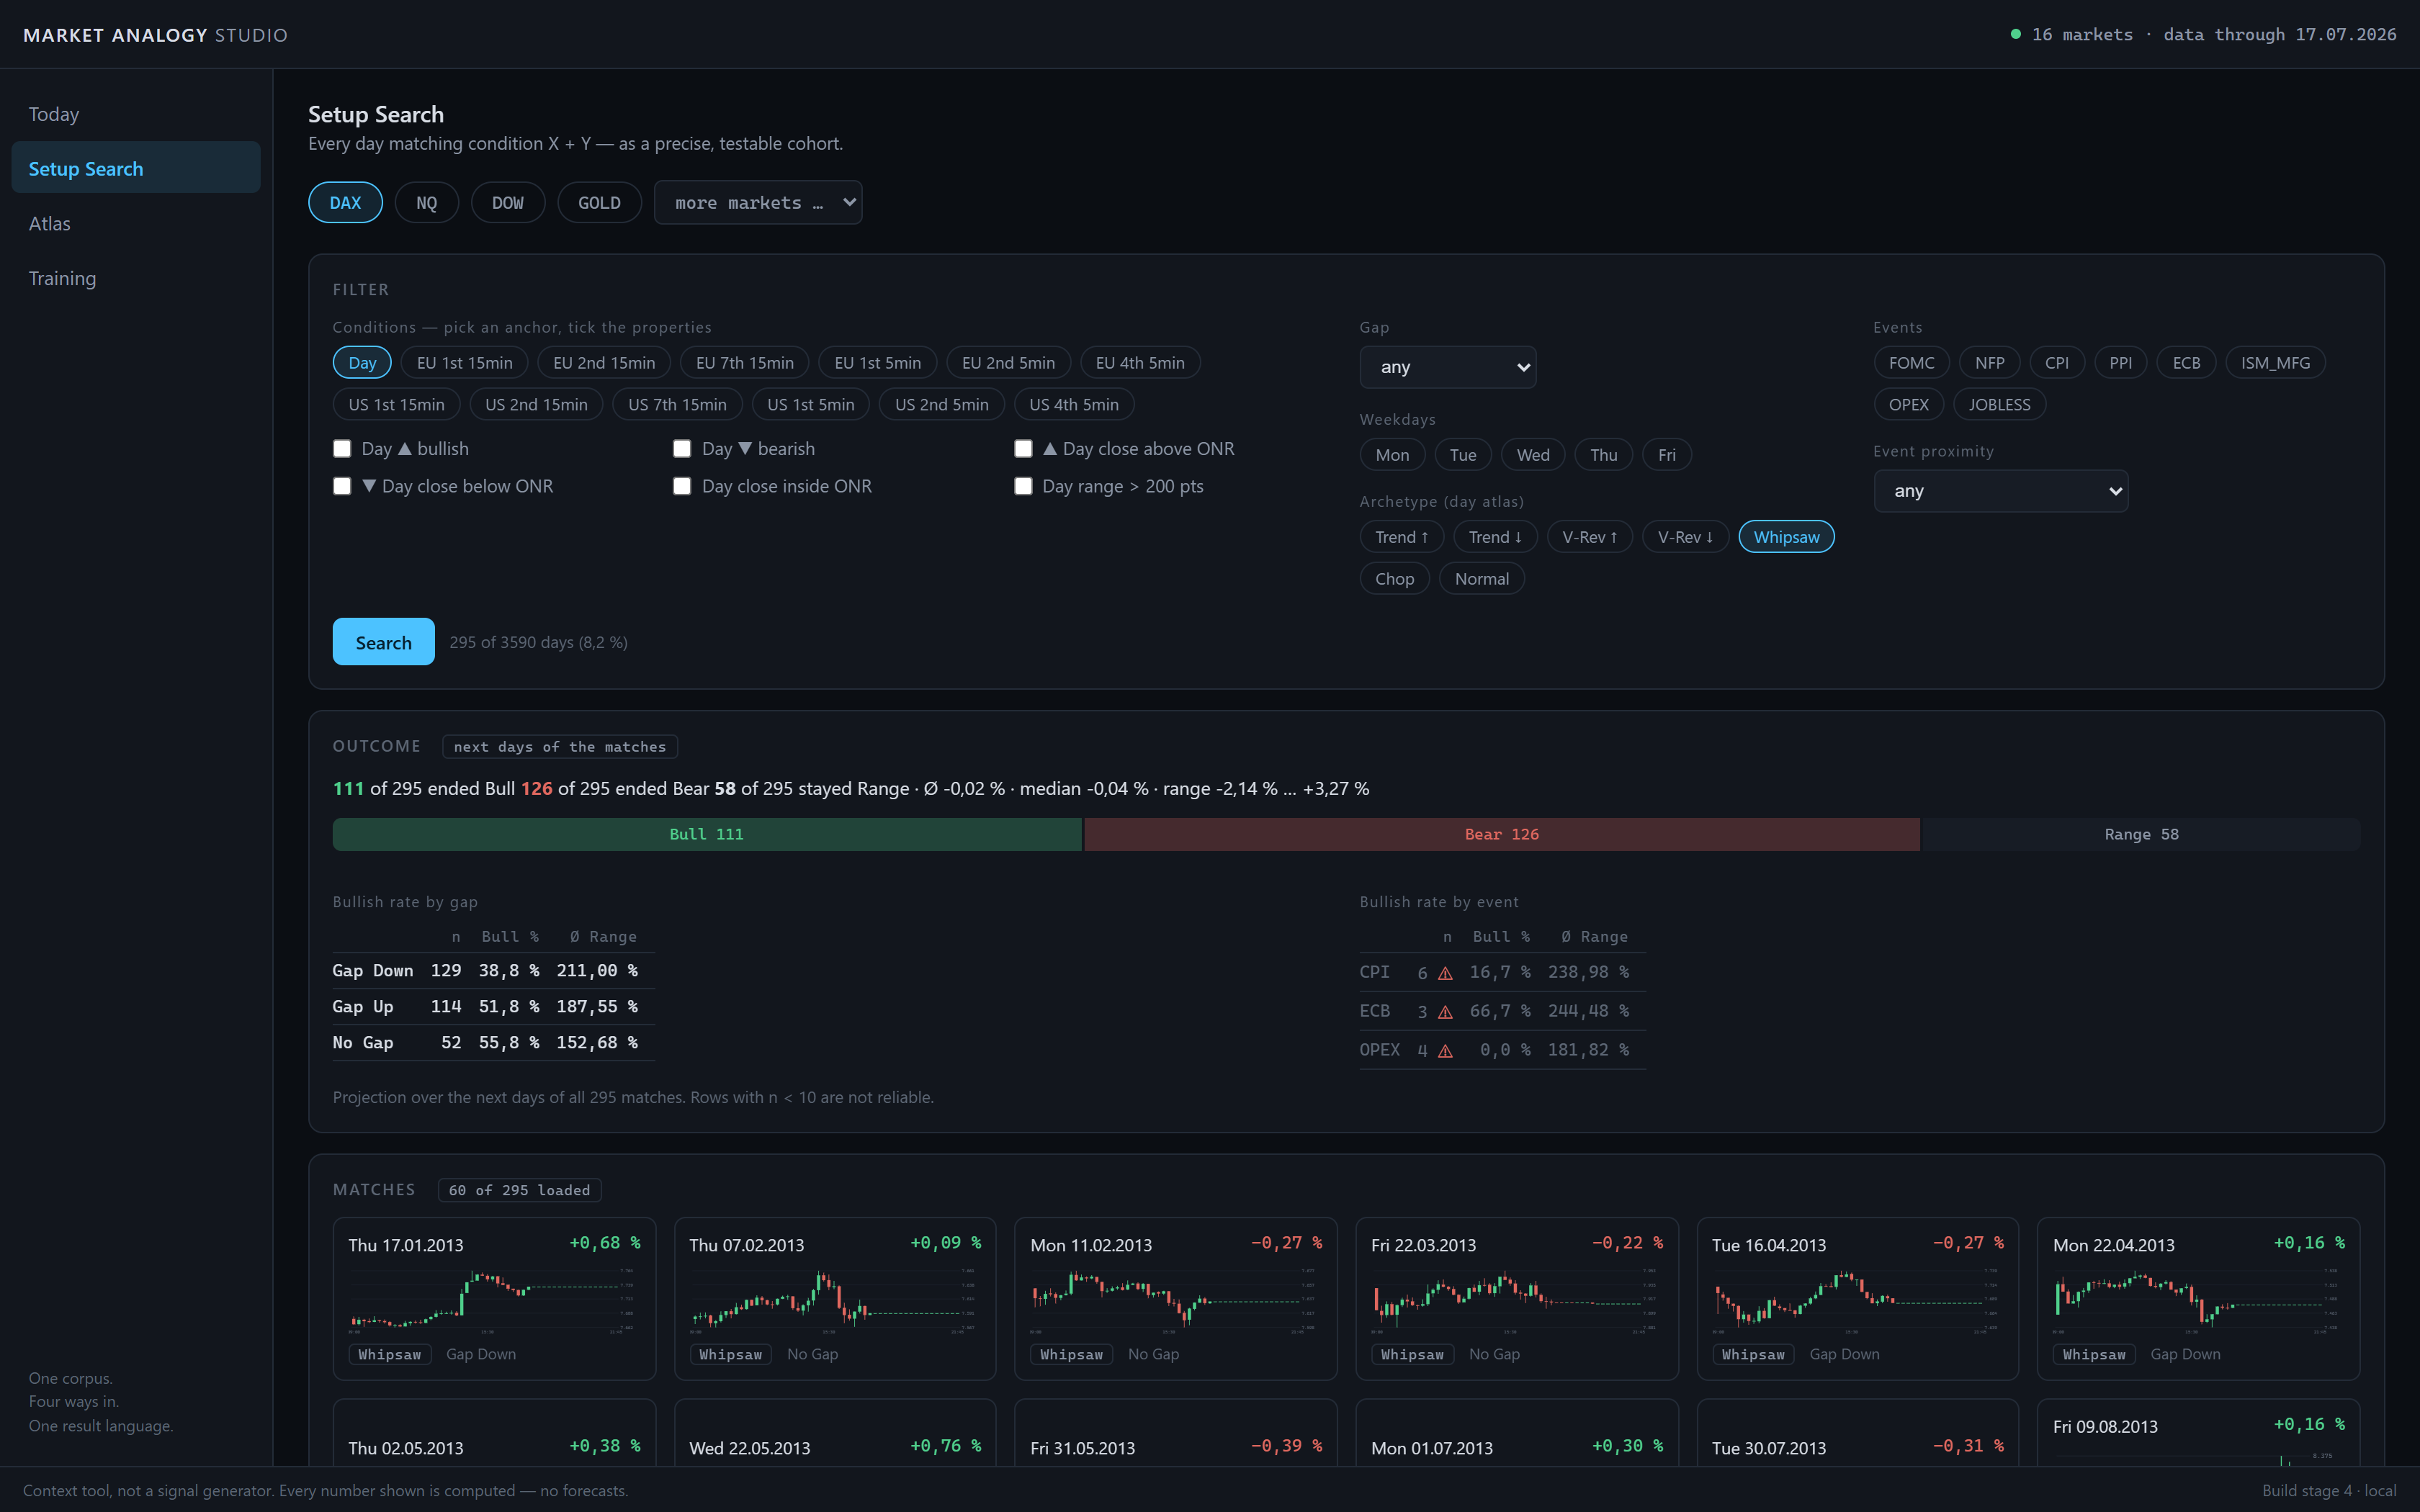
Pick anchors, tick properties — then inspect the cohort: bull/bear/range of follow-up days, rates by gap and event. Rows with too small an n carry a warning.
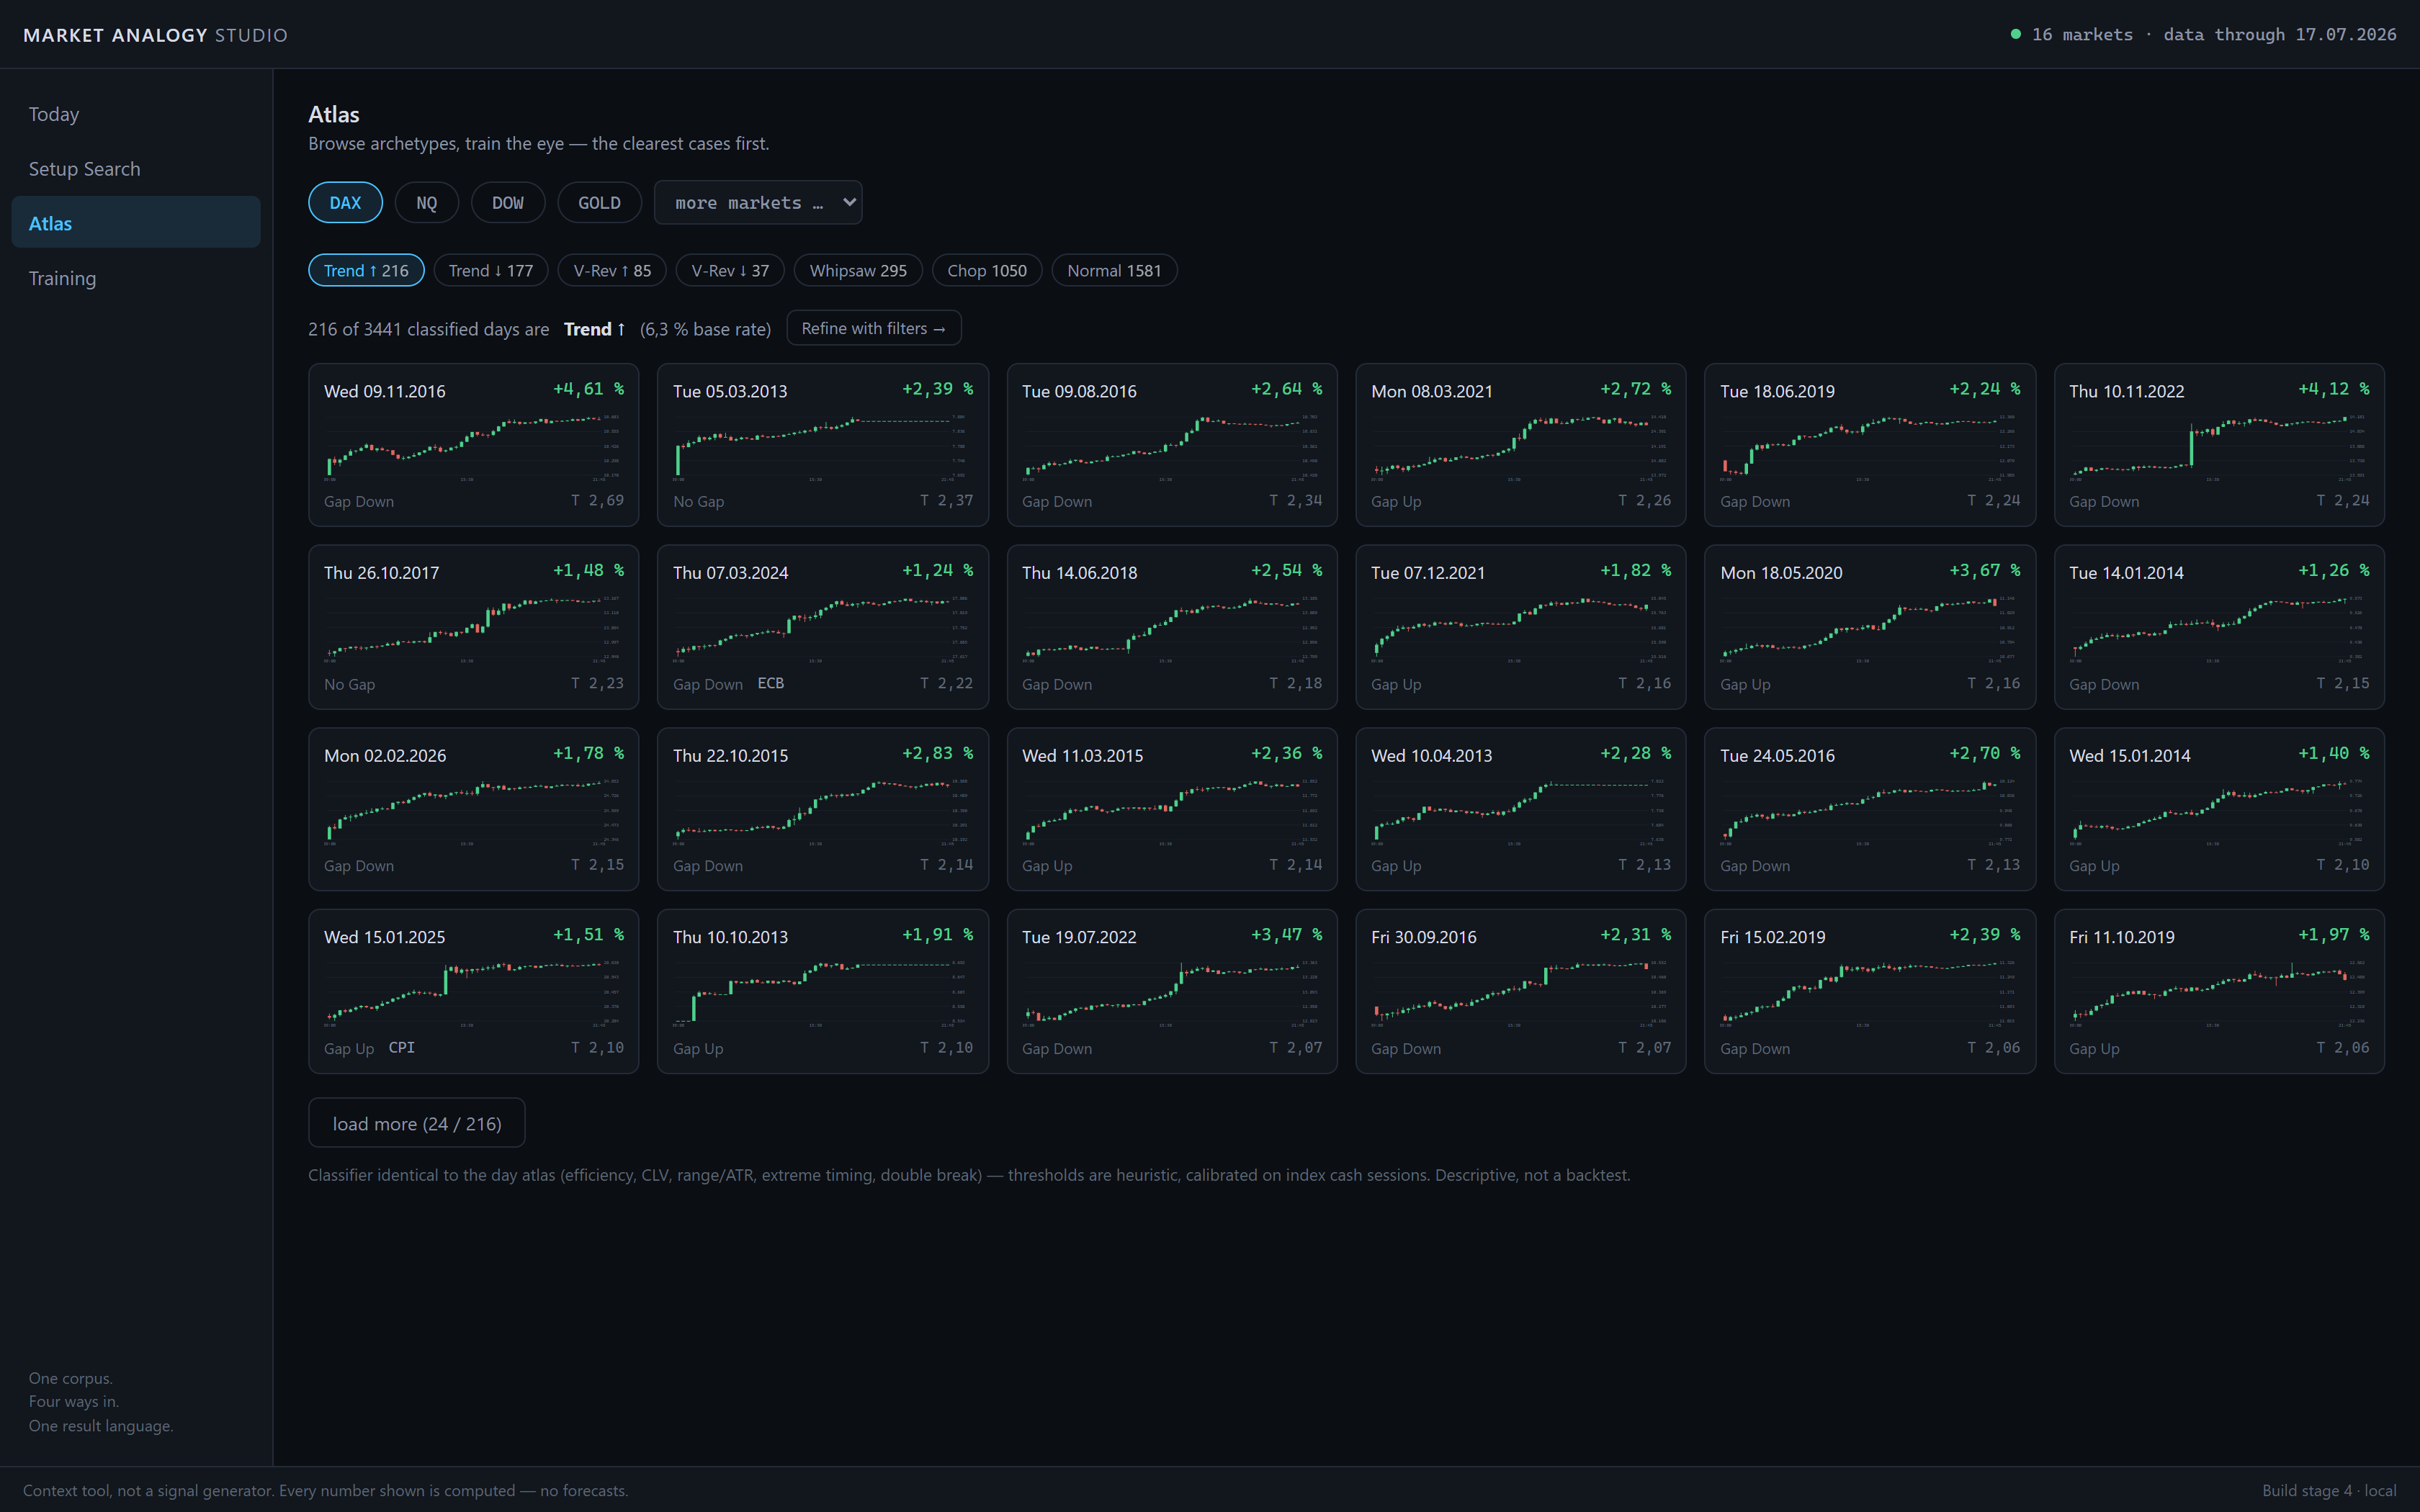
Archetypes with their base rates, sorted by typicality — clearest cases first. For browsing until the eye recognises the shape.
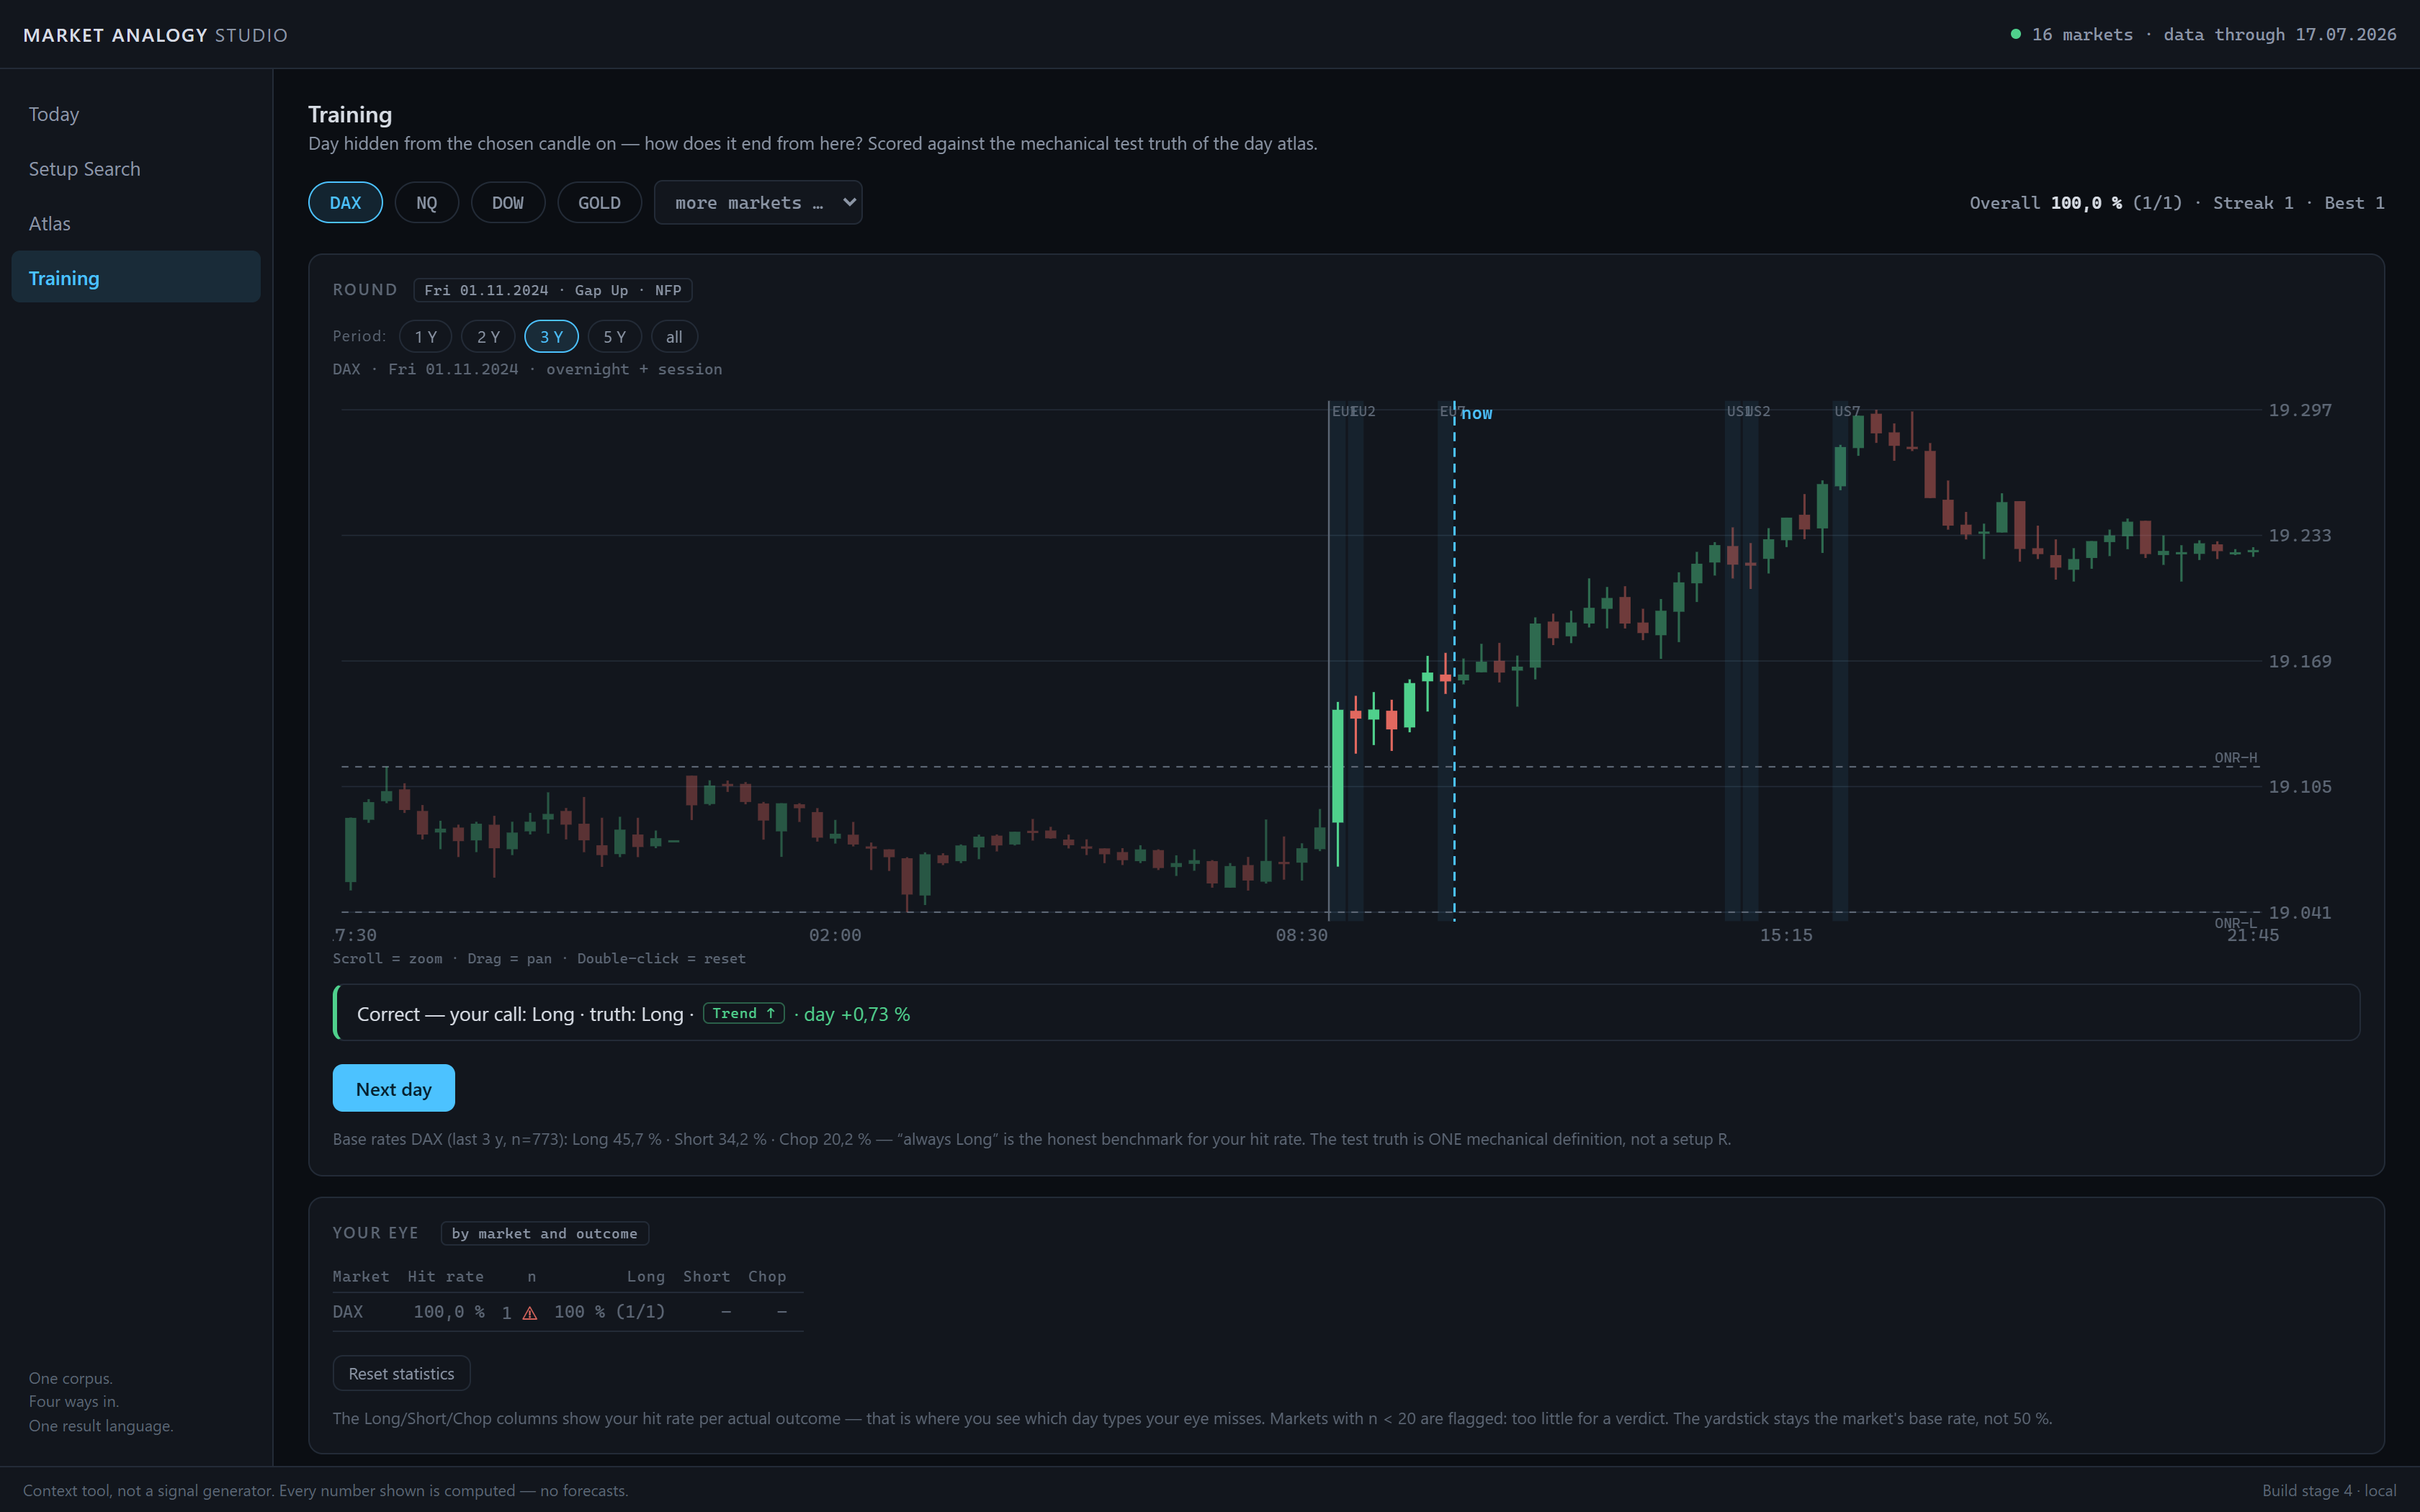
Day hidden, decision, resolution. You are measured against the market’s base rate — not against 50 percent.
Real price data, local, updated daily.
Sixteen markets at 5- and 15-minute resolution, back to 2013 — roughly 3,600 trading days per market. Sessions, overnight ranges and anchor candles are defined per market in local trading time, not blanket UTC. A background job keeps the data current.
Runs on your machine
Desktop application with a local data set. No cloud dependency, no forced account, your analysis never leaves the machine.
Open source
The complete source is open — classifier, similarity measure, statistics. Every number can be recomputed instead of trusting a black box.
Every number is computed
No value is decorative. Small samples are flagged as unreliable, statistics carry their n, and benchmarks sit next to them — a hit rate without a base rate is worthless.
Open source and free.
The complete studio is on GitHub under AGPL-3.0 — source, classifier, statistics. Clone it, drop in your price data, run it. Price data is not included: the repo documents the expected parquet format, you pick the source.
Python and Node are required. A packaged installer without those prerequisites will follow later — that one will be paid, the source stays free.
The studio is a context tool, not a signal generator, and not investment advice. Historical similarity says nothing about future prices. Archetype thresholds are heuristic and calibrated on index sessions.